|
iMedia Application Laboratory |
|
|
|
iMedia Application Laboratory |
|
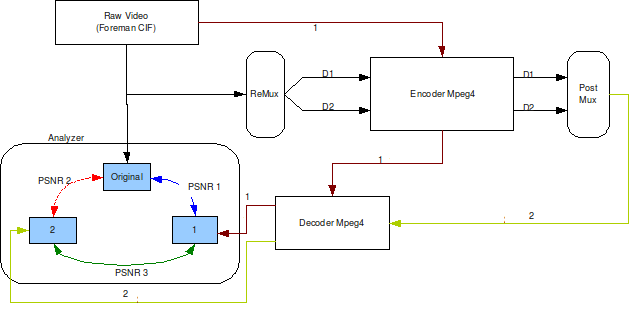
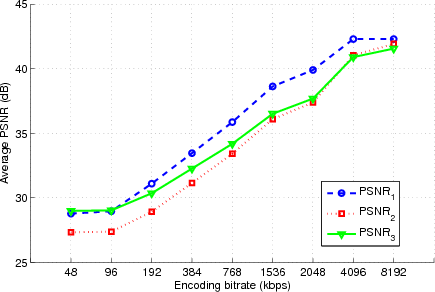
In this section, we present the results for the scenario exposed in RoSE implementation diagram. In this firt tests we will highlight the distortion introduced by the 2MD technique. For this reason the Linux Bridge has been set without the introduction of errors, like a ideal transmission channel. In particular, the conceptual scheme used for this fase is observable in Figure 1. It can not be obvious that even in the case of there are not errors in transmission and both the even and the odd frames are received, after the postmuxing operation there will be some PSNR difference. The rate-distortion curves for Foreman and Mobile sequences are plotted in Figure 2. Three cases are considered for PSNR evaluation. These measurements are marked as PSNRi on Figure 2. In the first metric, PSNR1, the distortion due to encoding in MPEG4 is measured. This case is also equivalent to a single sender and receiver transmission without MDC by sending all the video packets using a single route under perfect channel conditions. This is plotted as the dashed line in Figure 2. In the second case, we measure the distortion cumulatively due to both MPEG4 and the subsequent MDC stage (MPEG4 decoding/encoding and MDC operations). This corresponds to PSNR 2 and shown as the solid line in Figure 2. And in the final case, PSNR 3 measures the distortion due to MDC. This is the most significant metric for focusing solely on the effect of MDC.
The average PSNR values for varying bitrates using raw video inputs and MPEG4-coded output at the Remux module are listed in Table I. Specifically, the average PSNR values for Foreman sequence from this table are plotted in Figure 2(a). For this sequence, the PSNR1 value is about 28.96 dBs for 96 kbps compared to 42.30 dBs for 8192 kbps. The PSNR2 has smaller values but follows a similar trend: about 27.37 dBs for 96 kbps compared to 41.93 dBs for 8192 kbps. The PSNR3 value increases more sluggishly and is about 29.03 dBs for 96 kbps compared to 41.56 dBs for 8192 kbps. All PSNRs monotonically increase for increasing bitrates. The PSNR degrades substantially for low bitrates in all cases. As the bitrate increases, the difference between encoded-decoded MPEG4 output and original video fades since, for the high bitrates, single compression-decompression affects the quality of the video marginally. Therefore the gap between PSNR3 and PSNR2 closes and PSNR3 converges to PSNR2 (i.e., the MDC-free encoded-decoded sequence is almost identical to the original raw sequence in that case). These objective metrics match the actual quality of the videos because an obvious difference between qualities can be detected when the sequences are visually evaluated: the perceptual quality improves for increasing bitrates as seen in Figure 5 and 6. These trends are valid for all of the input sequences.
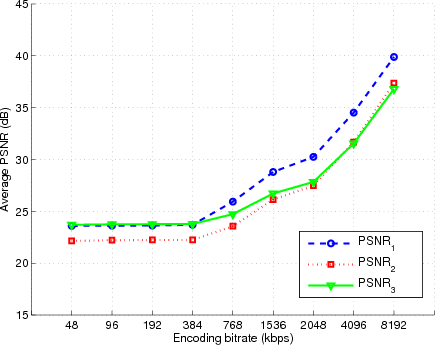
The average PSNR values for Mobile sequence is also shown in Figure 2(b),. For the other four sequences, we observe the S-curve showing an initiation phase, then fast growth and a final steady-state behavior in PSNR values as listed in Table I. However, this curve has not reached the steady-state region and ends up with a lower PSNR value than the other sequences. The reason is that this sequence has very rich texture with camera movement. If the encoding bitrate is increased beyond 8192k, the average PSNR will increase and then the saturation will be observed around the same PSNR values as the other sequences.
|
|
|
TABLE I
|
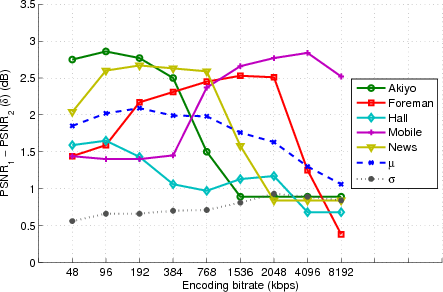
We also investigate the difference between PSNR1 and PSNR2, denoted as δ and defined as
 | (1) |
It represents the pure PSNR overhead or penalty for integrating MDC in the transmission chain. Because the experienced PSNR would be PSNR1 without MDC whereas it is degraded to PSNR2 with MDC. This metric is dependent on the the characteristics of the input sequence and thus shows diverse behavior. The experimental results are shown in Figure 4. For Foreman sequence, δ values start from 1.59 for 96 kbps and increases up to 2.53 at it peak for 1536kbps. Then, it drops down to 0.37 for the last bitrate. This is expected since both metrics suffer from extreme degradation for very low bitrate and almost lossless compression for very high bitrate. On the contrary, However, all the sequences except Mobile shows one common trait: the final δ is always smaller than the first δ. Again, Mobile sequence needs to reach higher bitrates to complete its evolution to a stable point. It will also decrease to a lower value for bitrates larger than 8192k. The average value (μδ) over test sequences ranges between 1.06 (for 8192kbps) and 2.09. It peaks in the midrange of the bitrates. Thus, it shows a consistent behavior with a parabolic typology. The standard deviation (σδ) ranges between 0.56 and 0.93. These metrics are also plotted in Figure 4 with dashed and dotted lines, respectively.
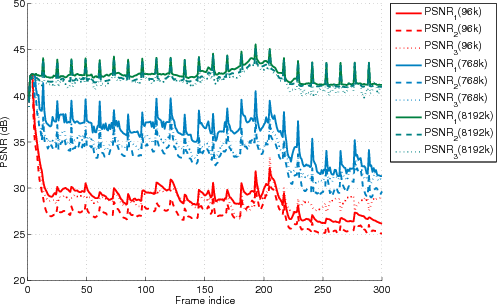
The same trend is also apparent in Figure 3. In this figure, PSNR performance for the entire sequence with encoding bitrates 96 kbps (blue), 384 kbps (red), and 8192 kbps (green) are shown for representing the general behaviour. Other bitrates are omitted for the sake of brevity. Solid lines are for PSNR1, whereas dashed and dotted lines represent PSNR2 and PSNR3, respectively. All PSNR values behave as expected and degrade for decreasing encoding bitrates. We also observe the diminishing returns for increasing the bitrate to very high bitrates. The PSNR gain becomes much less sensitive to increasing bitrate for high bitrates (the gap closes between consecutive bitrates.) As the limit case, when the compression is omitted (the bitrate passes the raw video bitrate), the gain from increasing the bitrate will be zero. Also, a periodicity is observed due to independent-coded I-frames in the sequence.
It is an interesting fact that for low bitrates such as 96k, when the compression is repeated, the psnr values slightly change (very minor variations in less than 10 percent of results). However, for large bitrates such as 8192k, the results are exactly reproducible.
For visual evaluation, we provide sample frame captures from original, remuxed and postmuxed video sequences in Figure 5 and 6. These captures exhibit the positive correlation between the quality and encoding bitrate in the system. The performance loss due to MDC stage (remux+postmux) is hard to perceive with visual inspection. The significant quality degradation in all of the different cases for low bitrate encoding is to be noted.
|